Tag: Strategy

  • Netflix [NFLX] attractive entry?

    Pros
    – Paramount/WBD merger creates a highly leveraged competitor with questionable management.
    – Strong FCF and balance sheet
    – Best in class brand equity
    – Trading below historical norms ( PE ).
    – Continued tailwinds in Emerging/Frontier markets
    – AI lowering production costs
    – Strong management (pioneering talent density).

    Cons
    – Amazon Prime and their massive scale
    – Younger cohorts increasingly gaming and watching UGC content
    – Saturated developed markets
    – Uncertainty regarding product expansion/changes to product mix
    – Removal of KPI’s such as semi annual watch time

    Summary
    Ad tiers to drive increased adoptions in emerging/frontier markets. Clear path for AI to improve margins. Plausible market share gain in short term, as competition must improve balance sheet. Development of AD monetisation infrastructure to decrease margins in short term. Netflix is cheap based on historical averages – by some margin, attributable to removal of KPI’s, changes to monetisation and fears of market saturation. The market is increasingly viewing Netflix as a mature media conglomerate instead of as a hyper growth story. If Netflix can maintain high single digits growth, then the current valuation is attractive.

    notes:

    I think AD tiers was a very deliberate initiative to increase reach to emerging/frontier markets. One could fear this would impact margins, as the subscription base grows outside developed nations (lower arpu). Though, the low incremental costs of each new customer, properly offsets this.

    Netflix is required by law to have 30% local produced content. This creates a moat for new entrants, but levels the playing field with incumbents. Note. Amazon & HBO/Paramount has wide access to local content, due to their ownership of local studios.

    Quality companies typically trade at a premium.
    And PE 20 is that.

    Netflix has over a 10 year period consistently improved margins and grown revenue – while it is not a indicator for future performance, it is certainly pointing towards excellent management. Also the company exhibits quality indicators such as massive FCF, profitability and a solid balance sheet. Thus Netflix command a premium valuation.

    Profitability:

    Gross margin = 49%.
    Net income margin = 24%.

    Return on assets = 15%.

    Liabilities:

    Liabilities/assets = 52%.
    EBITDA/Interest = 18.5

    2026 PE = 20x.
    2026 EV/FCF = 24x.

    Analyst expectations:

    2026 PE = 20.4x
    2027 PE = 19.2x
    2028 PE = 16x

    2026 guidance is 13-14% revenue growth (12% FX neutral) and a operating margin of 31,5%.

    A 10 year DCF; exit multiple 20, revenue growth 10% and operating margin improving 0,25% yoy.
    > 6% discountrate. Fair value 115 USD.
    > 8% discountrate. Fair value 85 USD.
    > 10% discountrate. Fair value 81 USD.

    Netflix is my second biggest investment at around 15% of portfolio.
    Not financial advice. I can have made mistakes. Always do your own due diligence.

  • Tesco is a sell

    The Bull thesis

    By leveraging its extensive consumer data, Tesco can launch products that have superior market fit. Increasing white-label product sales are going to have a positive impact on margins. Tesco simply have the leverage and data advantage, to take this market share away from exciting food and beverage brands.

    Furthermore, Tesco can efficiently scale their product mix, by leveraging the Tesco brand into mobile services, insurances and ecommerce.

    Tesco has a ton of prime locations, that new entrants would have to compete directly with if they want to take market share and grow in UK. Furthermore, they have economics of scale to leverage stronger deals with suppliers and decrease overall costs.

    To sum: Tesco has strived to improve their brand equity, and this is reflected in their market share development. All the while, the Tesco brand can be leveraged across services.

    The Bear thesis

    Tesco has previously failed entering USA and ASIA. This makes the case for a limited runway – market growth strategies, might not be for Tesco. Tesco is highly exposed to the UK consumer, and growth is limited to increasing share of wallet. Market penetration strategies have simply not been feasible. Especially with Tesco’s local appeal. Competition from Aldi and Lidl is likely to affect margins and earnings growth for the foreseeable future. White Tesco is considered a consumer stable, and they are – earnings are likely to be slightly affected by volatility in consumer purchasing power in the UK and input costs. Furthermore, the British pound has underperformed the EUR and USD for a while now and might have a material impact for the foreign investor.

    While the bull case for Tesco heavily emphasizes margin expansion, the UK governments are heavily opposed to increased food pricing, possibly creating a regulatory risk if grocery stores become too profitable. Tesco’s brand is not strong enough, as consumers simply don’t care if they shop at Aldi, Lidl or Tesco. They are picking the cheapest and most convenient grocery store. Finally, A 5–10-year corporate bond provides a yield similar to Tesco’s at current valuations.

    To sum: Competition is fierce, market penetration growth is limited and risks pertain.

    Conclusion

    I believe Tesco is going to increase its margins, through white labels and improved brand equity – but their market share is most likely to stay flat in the short to midterm. I assess Tesco to be fairly valued, trading at a premium to other retailers. This is not unreasonable since they are and have the potential to expand product categories in both vertical and horizontal integration.

    They have a brand that Is deeply embedded in UK culture and that people increasingly trust (partly attributed to past setbacks). Issue comes with brand dilution, people don’t trust cell phone providers and especially not insurance companies. This will increase distrust in Tesco, hurting their brand equity.

    In all fairness, investing in grocery stores drives similarities to investing in car makers or airlines. Massive competition drives uncertainty about future growth and compressed margins.

    Tesco at a pe above historical averages, above industry averages in a risky macroeconomic/regulatory environment does not condone investing.

    I appoint a sell rating, as Tesco fair value is PE 13. 23% below current PE. Note: Tesco might be able to leverage their brand across segments, gain market share etc. but based on their marketing strategy this is too questionable. There are even better investment opportunities in today’s hyped markets. Consumer staples as a sector have underperformed, and rightfully so – they were way too expensive! But they are still not value.

    About Tesco

    Tesco is Tesco, Tesco Mobile (UK’s biggest mobile network operator), Tesco insurance & money services, One Stop, Booker (UK’s leading food and drink wholesaler) & Dunhumby (A global leader in customer data science).

    Tesco is in five markets, with UK being the most significant market (in terms of size). Tesco is the leading grocery retailer in UK with 28% of the market share and 4500 stores. Tesco also has 180 stores in Ireland, 180 in Czech Republic, 180 in Slovakia and 200 in Hungary.

    The Tesco Brand (grocery stores)

    Tesco Grocery Stores (CBBE):

    Tesco brand salience (awareness & recognition)

    Tesco, with their long history and massive presence in the physical environment in UK drives high awareness and recognition. Most consumers in UK, have at some point evaluated their opinion on Tesco for better or worse. This creates strong brand nodes, which makes consumers able to quickly know exactly what the Tesco symbol symbolizes (depth). The frequency of how often these brand nodes are recalled is highly dependent on the physical environment (width).

    Brand Image (identity mix)

    Tesco’s supermarkets are generic supermarkets. They don’t particularly appeal to the seven senses. They are brutalist like architecture with bad smells. They are not made to be pleasant experiences. They are created to be convenient and offer large selections of groceries. Tesco’s stores are massive, offering a wide range of products.

    Tesco is a low-price mass retailer, and prices its products as so. With some premium products. Tesco’s white label brand (Tesco Finest) is not an exception, these are meant to be premium products.

    Tesco’s employees are wearing generic ( ugly ) uniforms. The logo has not been updated since inception, and is a rigid red text stating Tesco. This is visible on the front, on the employees and on the shopping bags.

    Tesco’s promotions are personalized offerings with email/app notifications and tv advertisements. Tv advertisements are good at reaching an older audience and create awareness (top funnel). App/email notifications are good for driving loyalty (bottom funnel).

    Brand Performance

    The primary characteristic of Tesco is the accessibility of food. This is a point of parity with other grocery retailers.

    Secondary features of Tesco are massive breath of products (note – the grocery store). This is a point of difference from other grocery retailers. Further, Tesco is offering bundled products such as mobile and insurance. That Aldi and Lidl does not.

    Brand Judgements & Brand Feelings

    Brand judgements is the quality, brand credibility & brand consideration.

    Brand feelings is:

    1. What feelings does the brand elicit in consumers’ hearts?
    2. How does the brand make consumers feel about themselves and their relationship with other people?

    Tesco’s products are a direct reflection of the brands they are selling. Because the product is from Tesco, does not mean it is high quality. This is why food brands are still relevant today; they are something consumers use to identify products and themselves. Tesco’s finest are quality products at a premium price (masstige).

    When shopping at Tesco the supposed emotional reactions are the ones of being safe, comfortable and reassured. People want good quality and good price. They want to be reassured they are not cheated or getting sick. Shopping in a supermarket for most is not supposed to be an exciting and/or fun experience. Some might pick supermarkets on the basis on social approval and/or feeling pride. This is not the case with Tesco.

    Tesco’s brand credibility has suffered under past scandals, that older demographics (millennials and up) will still remember. Horsemeat in meat products, created distrust to the Tesco products and supply chain. Customers were saying – they don’t even know what they are selling. This lack of credibility makes the customer feel distrust and to an extent hatred towards the brand. How can you know what you are buying is, if the one who is selling it doesn’t even know. This shakes the consumers, as the bottom of the Maslow pyramid is hurt. Another scandal was financial fraud (inflating earnings). This made consumers think it was led by unethical profit first management, hinting at a deeply rotten organization with a toxic culture. Deeply hurting the brand equity and perceived positioning as a local brand (these are supposed to be credible and hold high ethics).  Anyhow, these things happened a long time ago but will still reflect the older demographics’ perception. Tesco is no longer the local grocery store; they are a multi-national corporation. Tesco has managed to improve their brand equity; this is reflected in their existence today. There simply would not be a Tesco without trust and credibility. Consumers who have been going to Tesco for years, feel safe going to Tesco – they know what they are going to get and they know they will not get sick. It is the same old. Tesco’s increase in market share can partly be attributed to their improved brand equity.

    When consumers consider where to shop, they consider first and foremost convenience (i.e. distance), the prices and the product mix. These considerations might change with consumer trends (i.e. purchasing power). Tesco’s club cards are a massive driver of consideration – especially for users in the paid tier.

    Brand Resonance

    Tesco’s relationship with their customers is most likely an interdependence relationship. Tesco is dependent on its customers and the customers er dependent on Tesco. In these relationships are more frequent and diversified and endure over time. Even when there is low affective involvement.

    Where in Tesco’s is placed in the four categories of brand resonance is difficult to assess and highly polarized. Being a retailer consumers will typically pick the one that is most convenient. This leads me to assess them as behavioral loyalty; consumers use Tesco simply because it is the one that is most convenient for them. But this doesn’t illustrate fluctuations in market share and loyalty cards. In fact, I will argue that an increasing number of consumers have a preference. They have their favorite products, and they know where things are. This moves them up in the brand resonance chain – some more than others.

    Tesco omni-channel marketing

    Tesco drives omni-channel marketing through their app. Data works as a competitive advantage. Tesco can leverage data points from a single consumer, partly because when consumers buy products in Tesco using their loyalty cards, they create a data point. The loyalty cards further let Tesco keep track and offer personalized discounts using AI. On top of this, data helps Tesco know what products are popular and which aren’t. This helps Tesco select products with a strong product market fit. They simply know what consumers want, before any brand they are selling knows – and this is likely to continue driving market share in their Tesco Finest segment.

    Tesco Positioning Strategy

    Tesco has over the years expanded into different services, using their Tesco brand (a Monolithic Brand). An approach that can drive high adoption rates, with little advertisement expenditure. The downside is that any harm to the Tesco brand will damage Tesco across its services. This brand architecture allows for the optionality of launching new services, for the investor an important growth driver. The key issue is that, the distrust the average consumer has in financial services might spill over to Tesco.

    Tesco’s positioning is using a local positioning strategy. They are appealing to the heritage, nostalgia and the mass. In its DNA, it is a worker’s brand. This is a strong positioning in UK’s proud “Glasgow” culture – creating mass appeal. This is emphasized by their latest support of British farmers and communities. This comes to expression through the identity mix, which I addressed before.

    The Tesco Community (Architecture of Affiliation Framework).

    Building a strong brand community is not only a marketing strategy, but also a business strategy that must be implemented across the organization. Brand communities drive increased loyalty. Note loyalty has been proven to follow market share, as is the case with the law of double jeopardy and the duplication of purchase law.

    Communities are not built around the brand; the brand should be built around the community. This requires a customer centric approach; something Tesco is implementing across all its businesses. Tesco is engaging with and in the community through partnerships with its community – the everyday working joe – through addressing key societal issues such as regulatory pressure on farmers, parental leave and healthy food for kids.  

    “At Tesco, we are campaigning not only on behalf of all our colleagues but for people and communities across the country. Our view is that reforms are long overdue. Paternity pay in the UK is the lowest in Europe and paternity leave is out of step with how most couples want to share their parenting responsibilities” How Tesco is backing working families

    “Our farmers told us data collection, innovation, financial sustainability and collaboration are all areas where we can help, and so that’s where we continue to provide assistance.

    Whether that’s testing and scaling innovation on our low carbon concept farms, providing financial support for farmers to achieve shared sustainability goals, or calling on the government to help establish a standardised framework for environmental data, we want to play our part in supporting our farmers and the wider sector” Partnering with our British farmers

    “We see the pressure families are under, particularly when budgets are tight and healthy food can start to feel like a stretch rather than a given. As a supermarket, affordability matters, but price alone does not solve the problem. What really makes the difference is everyday access, real, practical opportunities for children to eat fruit and vegetables as part of their normal routine” Free Fruit and Veg for Schools: Our Big Ambition to Reach One Million Children .

    Finally, brand communities should not be tightly managed. They belong to the community, and excessive corporate control destroys them. As illustrated with above citations, Tesco is not fighting the community, it is supporting the community/local culture through initiatives.

    While it might sound superficial, the people who engage in these activities are the community. It creates a tribe through connections.

    Tesco helps build its community through hubs (celebrity endorsements). This is for example the case with Jamie Oliver advertising Tesco Finest. Tesco is closest to a pool affiliation. Tesco’s customers are united by a common goal of cheap and convenient grocery shopping. This type of affiliation is highly scalable because it does not rely on relationships; it can simply be advertised. Pool affiliation is the weakest form because cheap shopping is not uniquely a Tesco thing; it is highly prone to competition from Aldi and Lidl.

    Valuation & Ratios

    Grocery chains usually trade at a pe around 10-15. Tesco is trading at PE 16.

    Tesco’s profitability is very low. With a consistent operating income of around 4-5%. And a net income around 1-2%. These are industry standard, but nonetheless they are unappealing.

    Note: Retail is 87% of their operating income.

    Tesco now

    As Aldi is being perceived as cheaper and running without same loyalty/omni channel features positions them strongly to directly capture Tesco’s local (workers class) appeal. Tesco recognizes this and specifically advertises using a price match on Aldi’s products. Simultaneously, is Tesco targeting (those premium brands) with (their others stores and Tesco Finest). Tesco is currently experiencing regulatory headwinds with considerations of capping food prices on necessities – which to me seem unlikely, as grocery stores are already operating on a low margin. Tesco is seeing growth in its insurance segment.

    Disclaimer

    Note: this analysis mainly addresses Tesco from a marketing management and strategy point of view. It is by now means an exhaustive analysis of all possible elements – for example it does not address economics of scale, competitive dynamics (porters five forces) or the macroeconomic and regulatory environment facing the company. Neither does it address the whole sale business or telecoms business etc. Investing requires a holistic approach, which accounts for all possible elements, to structure a genuine insight into the company’s current and future prospects for creating shareholder value. Future analysis must address the insurance business, as this is a particularly important aspect of the bull thesis (leveraging the brand). While the insurance business is still small comparatively, it has grown immensely over the last two years. Another important element that could and should be addressed is the vertical integration of, for example, the whole sale business and increasingly farming.

    Competitive advantage

    Tesco’s biggest moats are not brand equity and consumer loyalty. It is a geographical moat and economics of scale. The geographical moat is the placement of supermarkets, that new entrants will have a hard time competing with. They must either locate in a worse location or next to Tesco and/or another retailer. With the grocery store already running at low margins, this is expensive and thus unlikely to be executed. The economics of scale is leveraging deals with branded goods and cost advantages. Not a very strong moat, in a market with many big players.

  • Why investment analysts fail to outperform – A step by step guide to institutional underperformance

    Why investment analysts fail to outperform – A step by step guide to institutional underperformance.

    Initial comment:

    In Berkshire Hathaways annual meetings Charlie Munger referred to a concept called inversion – rather than asking, “How do I achieve success?” he would ask, “What are all the things that would guarantee failure?” His strategy was simply to avoid these mistakes.

    Keeping this in mind – the following text aim to explain how and why investment analyst underperform – it does not directly answer the mistakes the average investor makes, because the text assumes an investment funds perspective. In hindsight, this would have been a more relevant article.

    A step by step guide to institutional underperformance.

    Step 1. Become institutionalised

    Rely on flawed models like GGM, CAPM or APT – while forgetting business fundamentals. Alternatively – predict the macroeconomic environment down to the decimal, but still importantly always forget business fundamentals.

    Step 2: Nepotism is key

    Skills or track records – does not matter – what matters is that your rich family can reference you. Alternatively, get referenced by a friend. If neither is an option, you ought to get lucky – because there are finance bros and macro economist with better grades than you.

    Step 3: Become complacent

    You have now gotten your job. Here it is important – stop improving. Rely on fellow analysts predictions – and speedrun your due diligence. After all – your worldview is correct and your holistic godlike predictions must outperform. This leads us to the next step.

    Step 4: You are not biased or flawed in any way

    4.1 We have already established your godlike presence.
    (The Dunning-Kruger Effect).

    4.2 Always ignore contradictory evidence
    (Confirmation Bias).

    4.3 You have made your decision, do not change your opinion (Anchoring Bias).

    4.4 You may have lost money and time researching – I REPEAT – DO NOT CHANGE YOUR MIND (Sunk Cost Fallacy).

    4.5 Your fellow investment analysts price target are way above your initial assumptions – of course you are wrong – change your assumptions to match the almighty group (Group Bias).

    If you really want to generate alpha underperformance – there are loads of other biases to rely on, such as: Availability Heuristic, Hindsight Bias, Negativity Bias, Halo Effect: Automation Bias and historical/representation Bias.

    Step 5: Fees

    Just – always take high fees. This is an almost guaranteed way to underperform (most of your coworkers actually outperform before fees – you can do better!). Also, remember, high fees = high skills.

    Step 6: Diworseify

    Never let a high-conviction idea ruin a perfectly mediocre portfolio. Once you find a great investment, immediately dilute it with 50 terrible ones to “manage risk.” After all, if you drastically underperform the index, you get fired. You are even obligated to by law.

    Final comment

    Not all investment analysts seek to outperform the market – investing is not always about making the maximum amount of money – but in many cases its about preserving wealth.

    A point I think is sadly overlooked in these “randomly throwing darts and outperform investment funds” articles.

    Also keep in mind – everyone will make some of these “mistakes” – and no step will alone lead to underperformance. It is the sum of these steps, that likely – by average – lead to underperformance.

  • Valuation Rockwool

    Valuation Rockwool

    Introduction

    Rockwool A/S is a pure-play insulation giant currently trading around historic lows – largely driven by asset seizure by the Russian government. As the market is fixated on this one headwind, Rockwool still enjoys significant tailwinds, such as the Energy Performance of Buildings Directive (EPBD).

    The EPBD states that; “85% of buildings in the EU were built before 2000 and 75% have poor energy performance (…) Yet the annual energy renovation rate remains very low at 1%” (European Commission, 2026). This low hanging fruit, of increasing energy efficiency, is a driver for continued growth.

    Profitability & Valuation

    Rockwool currently has a 10-year and 5-year revenue CAGR of respectively 5,8% and 11,9% (Sheet, 2026).

    Furthermore, Rockwool had a 10-year and 5-year CAGR income growth of 13% and 28%, partly driven by increased profitability.
    – Ratios Illustrated underneath.

    (Marketscreener, 2026) (Sheet, 2026).

    These ratios are all stronger than competitors’, though attributable to differences in product mix. A proper comparison requires further details in profitability within glass and stone wool.

    Competitor ratio “analysis”:

    (MarketScreener, 2026) (Sheet, 2026).

    Kingspan trades at a PE at 19.3 and Saint-Gobain 13.5. Thus, Rockwool is trading at a discount to Kingspan and on par with Saint-Gobain. Note: Owens Corning is expecting a loss in 2025, but a 2026e PE at 12.2.

    Though analyst expectations for future growth creates a different picture:

    (MarketScreener, 2026) (Sheet, 2026).

    Finally, Rockwool trades at a 32% discount to their five-year average of 19.9 – Assuming a 2025e PE at 13.5.

    PE development:

    (Rockwool Russia, 2026) (MarketScreener, 2026) (Sheet, 2026).

    Rockwool continues to invest in capacity and optimizing operations – expressed by their high capex:

    (Marketscreener, 2026) (Sheet, 2026).

    Thus, Rockwool is essentially plowing all their earnings into new factories (Five-year average = 90%).

    Competitive advantages & MOATS

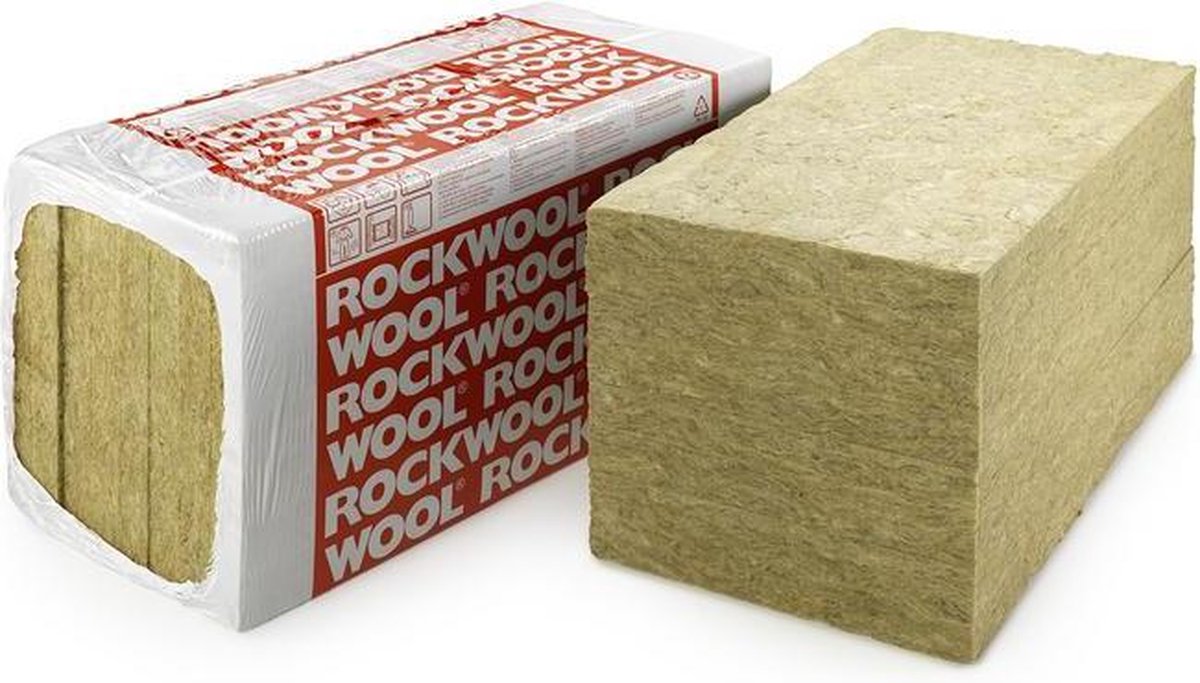
    Rockwool’s insulation products are enjoying moats – as traditional glass wool is combustible and thus prone to fires. This makes Rockwool the preferred choice in constructions such as timber and datacenters. While glass wool is a cheaper product, it also has a shorter lifespan – thus stone wool is essentially a quality product at a premium price.

    The asset seizure in Russia will contribute negatively to their earnings growth and margins. Some investors (and Rockwool) have been worried about giving a foreign company access to Rockwool technology – while this is a key risk, it might be overdone due to the logistics of insulation products. These voluminous products are on average transported for around 400 kilometers with no products crossing borders (Rockwool, 2025). This essentially creates a geographical moat while protecting against some geographical tensions such as tariffs.

    In general retail stores are in an attractive competitive situation, as they have more leverage to demand a lower price from suppliers. This might pressure margins in the longer terms, depending on Rockwool’s pricing power and channel management. Strong brands and quality products, demand better terms for negotiating prices – though, I cannot estimate the development of Rockwool and competitor’s product development – But, Saint Gobain (Isover) has developed a chemically engineered glass wool product that is lighter, cheaper and fire resistant – but on the downside more fragile and less soundproof.

    Finally, it is capital intensive to build the factories that make stone wool and further energy intensive to produce stone wool. Expenditures serve as a moat, as the high upfront costs serve as barriers to entry.

    Rockwool products

    Rockwool’s product mix is collected in two segments – insulation (79% of revenue) and systems (21% of revenue) (Rockwool, 2025, pp 17). Both segments are operating at an EBIT margin of 14-15% (Rockwool, 2025, pp 26). Insulation is insulation (stone wool) and systems are: Rockfon (panels for acoustic), Rockpanel (façade panels), Grodan (for roots, agriculture) & Lapinus (additive for brake pads etc.). The size of the business unit is in respective order (Rockwool, 2025, pp 21).

    Conclusion

    I expect Rockwool to be an attractive investment, largely attributable to its MOATS and sector-wide tailwinds. Furthermore, companies with such a strong track record and profitability often cost pe 20+. 

    This valuation can likely be attributed to short-term headwinds (asset seizure) and low analyst expectations for near-term earnings growth.

    This investment is a textbook example:
    – Double digit earnings growth
    – Low debt
    – Strong and expanding margins (though a small setback is expected)
    – Solid tailwinds (…)
    – Shareholder friendly

    Though risks persist:
    – Vulnerability to energy supply (regulation)
    – Product engineering from competitors (Isover Ultimate)
    – High depreciation of assets requires continuous investments in factories (overlooked in the price to earnings ratio)

    Disclaimer

    I am heavily invested in Rockwool, at around 21% of my total portfolio. I can have made mistakes. I am not a licensed financial advisor. I cannot advocate for investing in this company.

    Mental Notes / Future research

    Price elacity of Rockwool products from high salaries in construction? One Up Wallstreet states need for continuos investments as unfavourable. Need stronger comparison of competitors (Kingspan & Isover especially). Estimation of growth based on factory expansion and new factory construction (as i recall from earningscall there are 6 projects on the way).

    Sources

    Sheet, 2026:

    MarketScreener, 2026: https://www.marketscreener.com/

    European Commision, 2026: https://energy.ec.europa.eu/topics/energy-efficiency/energy-performance-buildings/energy-performance-buildings-directive_en

    Rockwool, 2025: https://www.rockwool.com/siteassets/investors/financial-reports/2025/annual-report-2024.pdf

    Rockwool Russia, 2026: https://tools.eurolandir.com/tools/Pressreleases/GetPressRelease/?ID=7874390&lang=en-GB&companycode=dk-rock&v=

  • Short Form Rockwool

    Short Form Rockwool

    INTRO

    Rockwool is a Danish pure-play insulation conglomerate. The stock is currently depressed by macroeconomic headwinds and recent seizure of its Russian assets.

    STRATEGY & MARKETING

    The stone-wool market has high barriers to entry due to capital intensity. Rockwool is vertically integrated, mitigating reliance on suppliers. Rockwool is gaining market share, driven by superior performance compared to traditional glass-wool. The superior performance comes from fire safety standards and product longevity. It is not unlikely, that increased timber constructions and data centers, are going to be growth drivers in US in the short term, while re-insulation regulation and reconstruction of Ukraine are “going to be” European drivers.

    VALUATION

    Rockwool is priced at a earnings yield of 7,5% Well bellow historical averages. Though, “on par with peers”. Rockwool has a strong profitability expressed by:

    Return on non current assets = 21%, Return on revenue = 14%.

    And a strong balance sheet expressed by:

    Liabilities/Assets = 20%, Income/Liabilities = 69%.

    Furthermore, assets contain barely any intangibles such as goodwill. Finally, the high earningsyield should be seen in light of also high earnings-growth, driven by margin expansion & revenue-growth. .

    10 year compound earnings growth at 20%, 10 year compound revenue growth at 6%.

    CONCLUSION

    Rockwool is a “Quality” company trading at a “Value” price. While the construction cycle is unpredictable, the Russian risk is now realized and likely priced in. Thus, the current valuation likely offers a significant margin of safety.

  • Update Pandora

    Update Pandora

    Pandora’s unaudited Q4 2025 earnings have triggered immediate caution across the market. The report reveals a softening US consumer and a sharp 7% decline in like-for-like growth across Latin America. Against a backdrop of rising tariffs and silver price volatility, the investment community has predictably fixated on a single metric: the potential erosion of EBIT margins. However, while valid, this financial anxiety overlooks a far more fundamental risk regarding whether Pandora can deliver on its marketing strategy to secure growth in both new and existing markets.

    The current strategic direction raises existential questions for a brand defined by “affordable luxury.” There is genuine scepticism as to whether jewellery with reduced silver content will satisfy the brand’s core demographic, or if these consumers will tolerate price hikes driven by tariffs and input costs. A prudent marketing manager would rightly fear that allowing external cost pressures to dictate pricing and product composition risks decoupling the brand from customer needs. The danger is that Pandora’s new lineup reflects its own supply chain constraints rather than what its customers actually want.

    Disappointingly, the initial communications from the new CEO, Berta de Pablos-Barbier, fail to address this demand-side peril. By stating a focus on “navigating the current market environment” and “reducing commodity exposure,” the leadership appears prioritized on defensive financial engineering rather than offensive market conquest. The vague commitment to “course-correct in select areas” lacks a clear strategy for arresting market share loss or reigniting brand appeal in struggling regions.

    I argue that the winning strategy lies in a fundamentally different approach: Pandora should be willing to accept margin compression in the near term to fund a massive expansion in marketing expenditures. In a fragmented global market—particularly in regions like Latin America—the priority must be acquiring customers and deepening brand equity. Sacrificing short-term profitability to solidify a competitive moat is the surer path to long-term earnings growth, ensuring Pandora remains the dominant player in affordable jewellery rather than a retailer protecting margins on shrinking volume.

    Source: https://pandoragroup.com/investor/news-and-reports/company-announcements/newsdetail?id=27746

  • Bandai Namco

    Bandai Namco

    Ticker: (7832.T). Not financial advice.

    Strategy

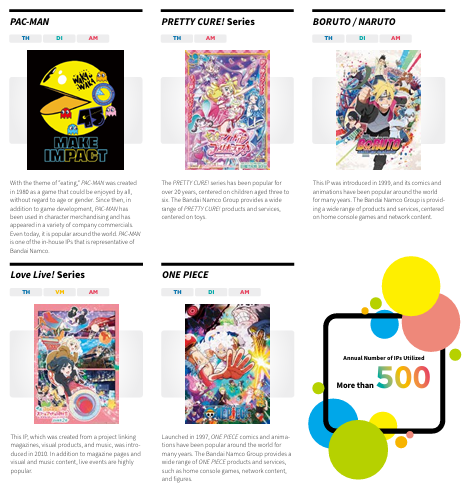
    Bandai Namco’s positioning is particularly compelling due to its ability to leverage franchises across games, toys, amusement parks etc. By monetizing IP through multiple formats, the company builds an integrated ecosystem that extends the lifecycle and economic value of each franchise. This structure creates meaningful moats, as success depends not on a single hit product but on coordinated execution across several categories.

    The primary risk is competition, particularly from rights holders such as Shueisha, which has stated ambitions to capture more value from its own franchises. However, partners like Shueisha lack the operational capabilities required to replicate Bandai’s model independently, as publishing, game development, and large-scale product commercialization rely on distinct and non-transferable skill sets. While competition remains a structural feature of the entertainment industry, franchise-driven ecosystems provide durability in margins and customer engagement.

    Multiples

    Bandai Namco is currently trading at a P/E of 24.4, representing a 12.6% discount to its five-year historical average and a 10% discount to peers. This multiple does not reflect first-half results, which indicate a modest increase in earnings. Assuming a long-term earnings CAGR of 10–14%, the implied annual return ranges from 12.7% to 20.2%, based on a 10% discount rate and an exit multiple of 24 under a continuous growth assumption. Over the past ten years, Bandai has delivered a CAGR of approximately 14%

    From a balance sheet and profitability perspective, Bandai Namco maintains low leverage and strong margins, broadly in line with peers.

    Bandai multiples:

    Liabilities/Assets28,01%
    Income/Liabilities42%
    Income/Revenue10,39%
    Income/Assets11,70%
    Income/Non Current Assets32,41%

    Notable mentions:

    • Kadokawa may increasingly pursue in-house game publishing rather than relying on Bandai Namco, which could reduce Bandai’s access to third-party IP over time.
    • A significant share of Bandai Namco’s IP exposure is tied to the anime segment, making parts of its growth dependent on continued demand within this category.
    • The current P/E multiple is partially influenced by the exceptional success of Elden Ring; as expectations normalize and release-related hype fades, reported growth and valuation metrics may compress.
    • The japanese yen (as illustrated vs the euro beneath).

    What MultipleStrategy thinks

    While Bandai Namco currently trades at an attractive valuation with strong profitability, structural risks to its Digital Business are emerging. The company relies heavily on licensing major IPs from media giants like Shueisha and Kadokawa—partners increasingly signaling intent to capture more value in-house.

    Signs of this shift are already visible. Kadokawa’s subsidiary, FromSoftware, recently reclaimed sole trademark rights for Elden Ring, indicating potential self-publishing of future blockbusters. Shueisha has launched Shueisha Games to develop indie titles internally, potentially still leaving room for Bandai Namco’s AAA studios.

    If these IP holders increasingly bypass Bandai Namco, the Gaming segment—responsible for a substantial portion of high-margin revenue—faces significant pressure. In contrast, the Toys & Hobby division remains protected by a moat of manufacturing and branding competencies, insulating it from similar disruption.

    In short, Bandai Namco remains a solid investment if it can maintain market share in its Digital Business, assuming continued global adoption of anime.

    ***Should mention:
    Bandai Namco owns Tekken & Gundam.
    – An older but relevant table illustrating margins and market caps across peers:

    Note: Square Enix is affected by one time effects.

  • Can Match Group Revive the Online Dating Market?

    Can Match Group Revive the Online Dating Market?

    Updated version: https://multiplestrategy.com/2026/04/22/match-group-update/

    Ticker: MTCH. Not financial advice.

    Match Group has negative equity, and half of their assets consist of goodwill. Their MAU (Monthly Active Users) has been declining since 2022. Furthermore, Match Group acquired HyperConnect in 2021 at what appears to be an overly optimistic price, leading to massive write-downs.

    Match Group recently changed their CEO (among other leadership changes), and as he stated during the Q2 earnings call: “Tinder needs a lot of work. It has grown stale because of short term monetization & lack of innovation.” Additionally, there is a general slowdown in the online dating market, and indications suggest Bumble has captured market share from them – along with other and more niche dating apps.

    On the other hand, Match Group has a reasonably profitable business, with an adjusted income / non-current assets ratio of 19% and an adjusted earnings / revenue margin of 17%. Furthermore, the new CEO intends to focus on making the company more agile, partly by laying off 20% of managers and reducing team sizes; he also plans to increase focus on product development. Established dating companies like Tinder and Bumble benefit from strong network effects.

    Even with Match Group’s negative equity and high proportion of goodwill, they are executing significant share buybacks amounting up to 130% of adjusted earnings. This can be explained by a ( long-term debt / interest expense ) of 2.4% and an adjusted earnings yield of 6.9%—in other words, low interest expenses and a low valuation (earnings per share relative to share price). This indicates a shareholder-friendly and aggressive capital allocation strategy that also suggests management believes the company is attractively priced.

    But – Match Groups debt ratio is simply too high, to justifying big share buybacks. While aggressive capital allocation is appreciated, the overall health of the company should come first. This is especially true since Match Groups refinancing could be coming in at higher interest rates. Furthermore stagnating revenue increases business risk which further increases cost of capital.

    I assume – The online dating market will continue to grow in the long term, following a normalization in MAU after a period of rapid expansion.

    Conclusion

    Match Group represents a high-risk turnaround case. While the company benefits from significant scale, network effects, and valuable user data, it faces major headwinds from elevated leverage, refinancing risks, and uncertainty regarding both execution and market development. Although the current valuation reflects many of these concerns, long-term success depends entirely on management’s ability to restore earnings growth and improve the value perceived by customers.

    Notable mentions:

    – User sentiment across the industry is historically poor, driven by a persistent perception that dating apps profit from keeping users single. The new CEO has signaled a strategic shift toward brand health, stating, “I would take a positive word of mouth over a $15 subscription any day.” This marks a critical potential pivot from short-term extraction to long-term value.

    – Interest expenses decreased in 2025, due to refinancing at a lower but stable interest. Decreasing the overall refinancing risk. Interest expenses should be higher in 2026, as there was a longer period in 2025 between paying off loans and settling new loans (Q3 2025). And liabilities/assets increased.

    – Match Group’s declining MAU stems from the Evergreen segment and Tinder, whereas Hinge is experiencing impressive growth.

    – Match Group has a adjusted earnings / (liabilities + goodwill) ratio of 8%.